Figure 1: Monitoring Pressure 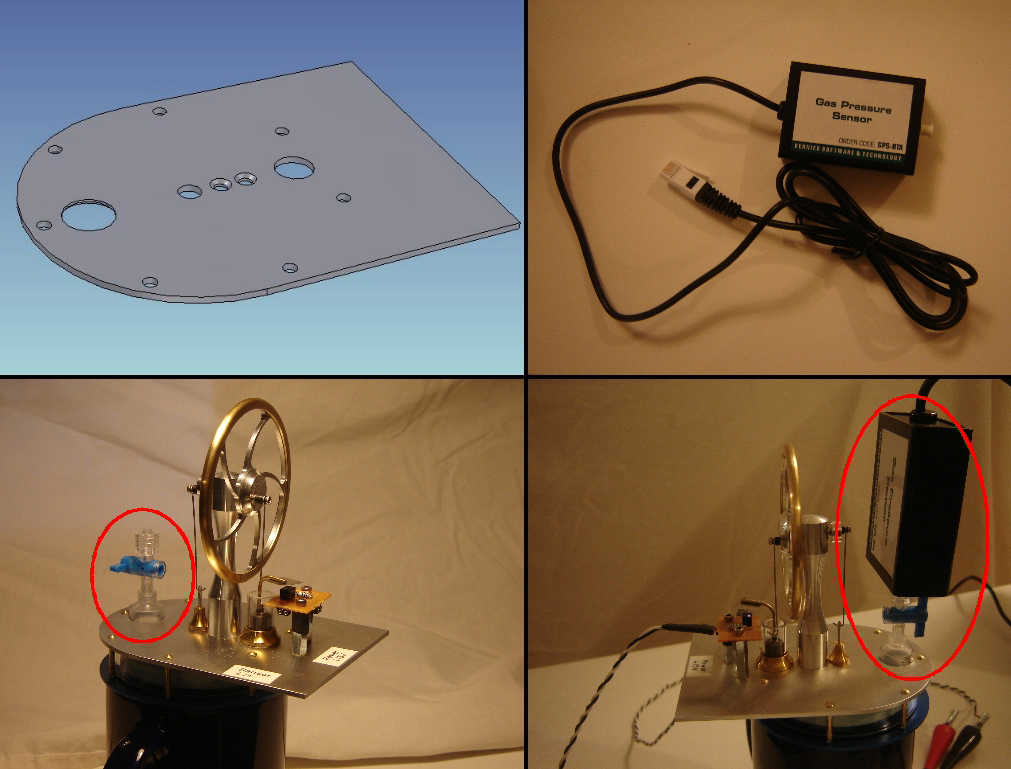
|
This page describes how a model stirling engine was purchased and then modified to accommodate instrumentation to monitor the pressure and volume of the gas in the engine. With these modifications and instruments, the PV-diagram of the Stirling engine could be monitored and displayed in real time. Monitoring Pressure A displacer-style Stirling engine (pictured here) was purchased from Kontax Low Temperature & Thermo-acoustic Stirling Engines. The original top plate was removed and replaced with a modified copy (top-left block of Figure 1). An additional hole, approximately 1.45 cm in diameter, was made in the top plate of the engine. The end of a syringe was cut and glued into the hole using Stycast epoxy. This seal needs to be airtight and must withstand moderate temperature gradients. A valve was mated to the syringe as in the bottom-left panel of Figure 1. A digital pressure gauge, which mates to the other end of the valve, from the Vernier company (top-right panel of Figure 1) was used to measure the gas pressure inside the engine. The bottom-right panel of Figure 1 shows the Stirling engine with the modified top plate and the digital pressure sensor installed.
|
Figure 2: Monitoring Volume 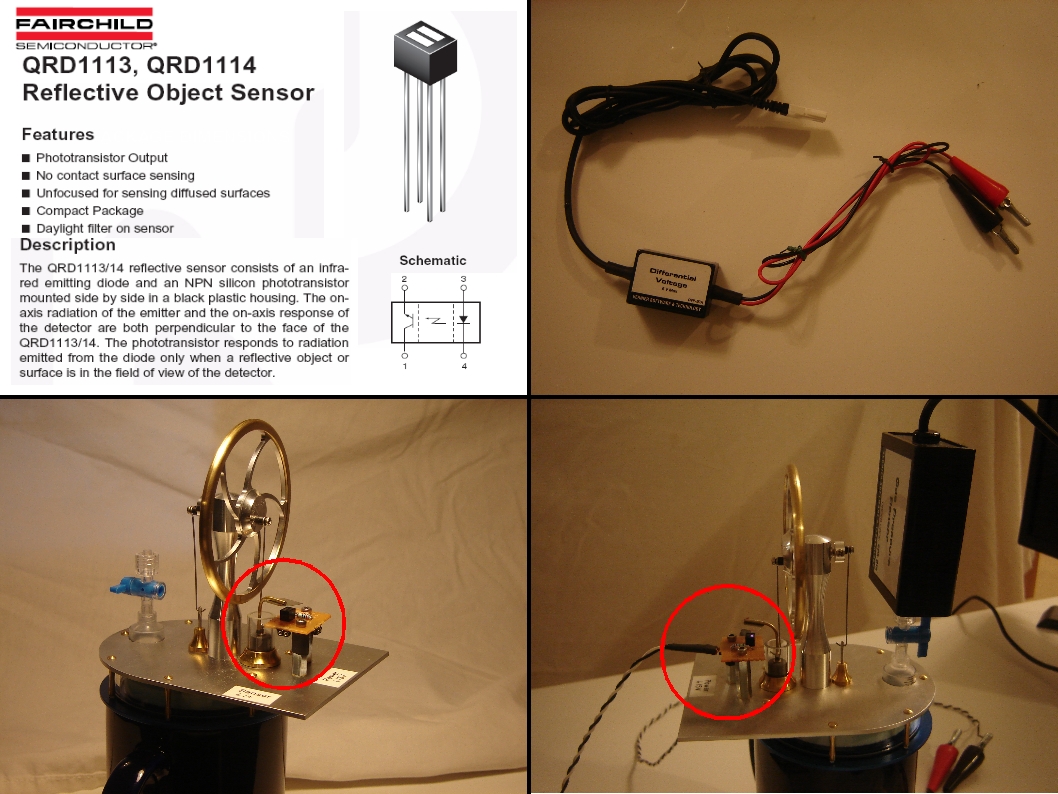
|
Monitoring Volume
To construct a PV diagram, the volume of the gas inside the engine must also be measured.
The volume change inside the engine is only due to the motion of the small, sealed power piston.
The large, loose fitting displacer piston simply moves the gas in the engine around, but does not
cause any volume change. To convince yourself of this refer to this figure.
Knowing the radius of the
Stirling engine's power piston, the change in volume can be calculated by measuring the change in
the height of power piston. A reflective object sensor (QRD1114) used to monitor the power piston height (top-left
panel of Figure 2). This sensor emits infrared light which gets reflected back to the sensor and detected by a photodetector.
The photodetector outputs a voltage that is proportional to the intensity of the reflected light.
The reflective object sensor was mounted on the modified top plate and a reflector glued to the power
piston, such that the motion of the reflector was linked to the motion of the piston,
as shown in the bottom-left panel of Figure 2. The voltage output by the photodetector can be converted into
power piston height using a calibration factor. The photodetector voltage was monitored using a Vernier
differential voltage probe (top-right panel
of Figure 2). The bottom-right panel of Figure 2 shows the entire height detection assembly.
|
|
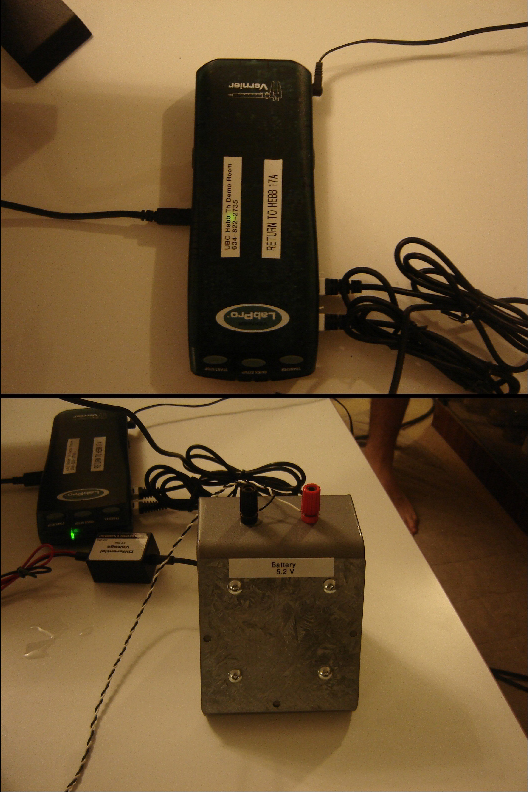
Data Acquisition with Vernier
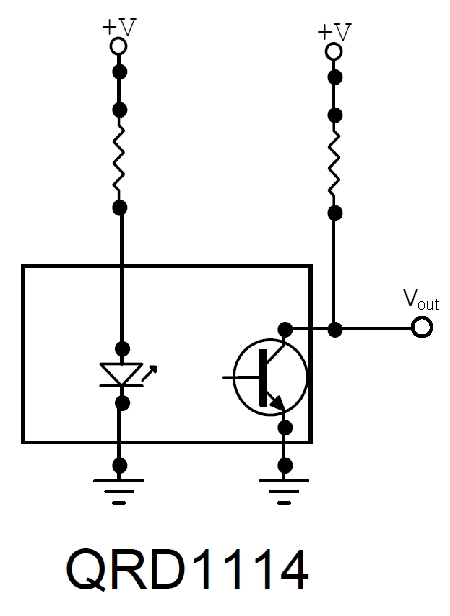
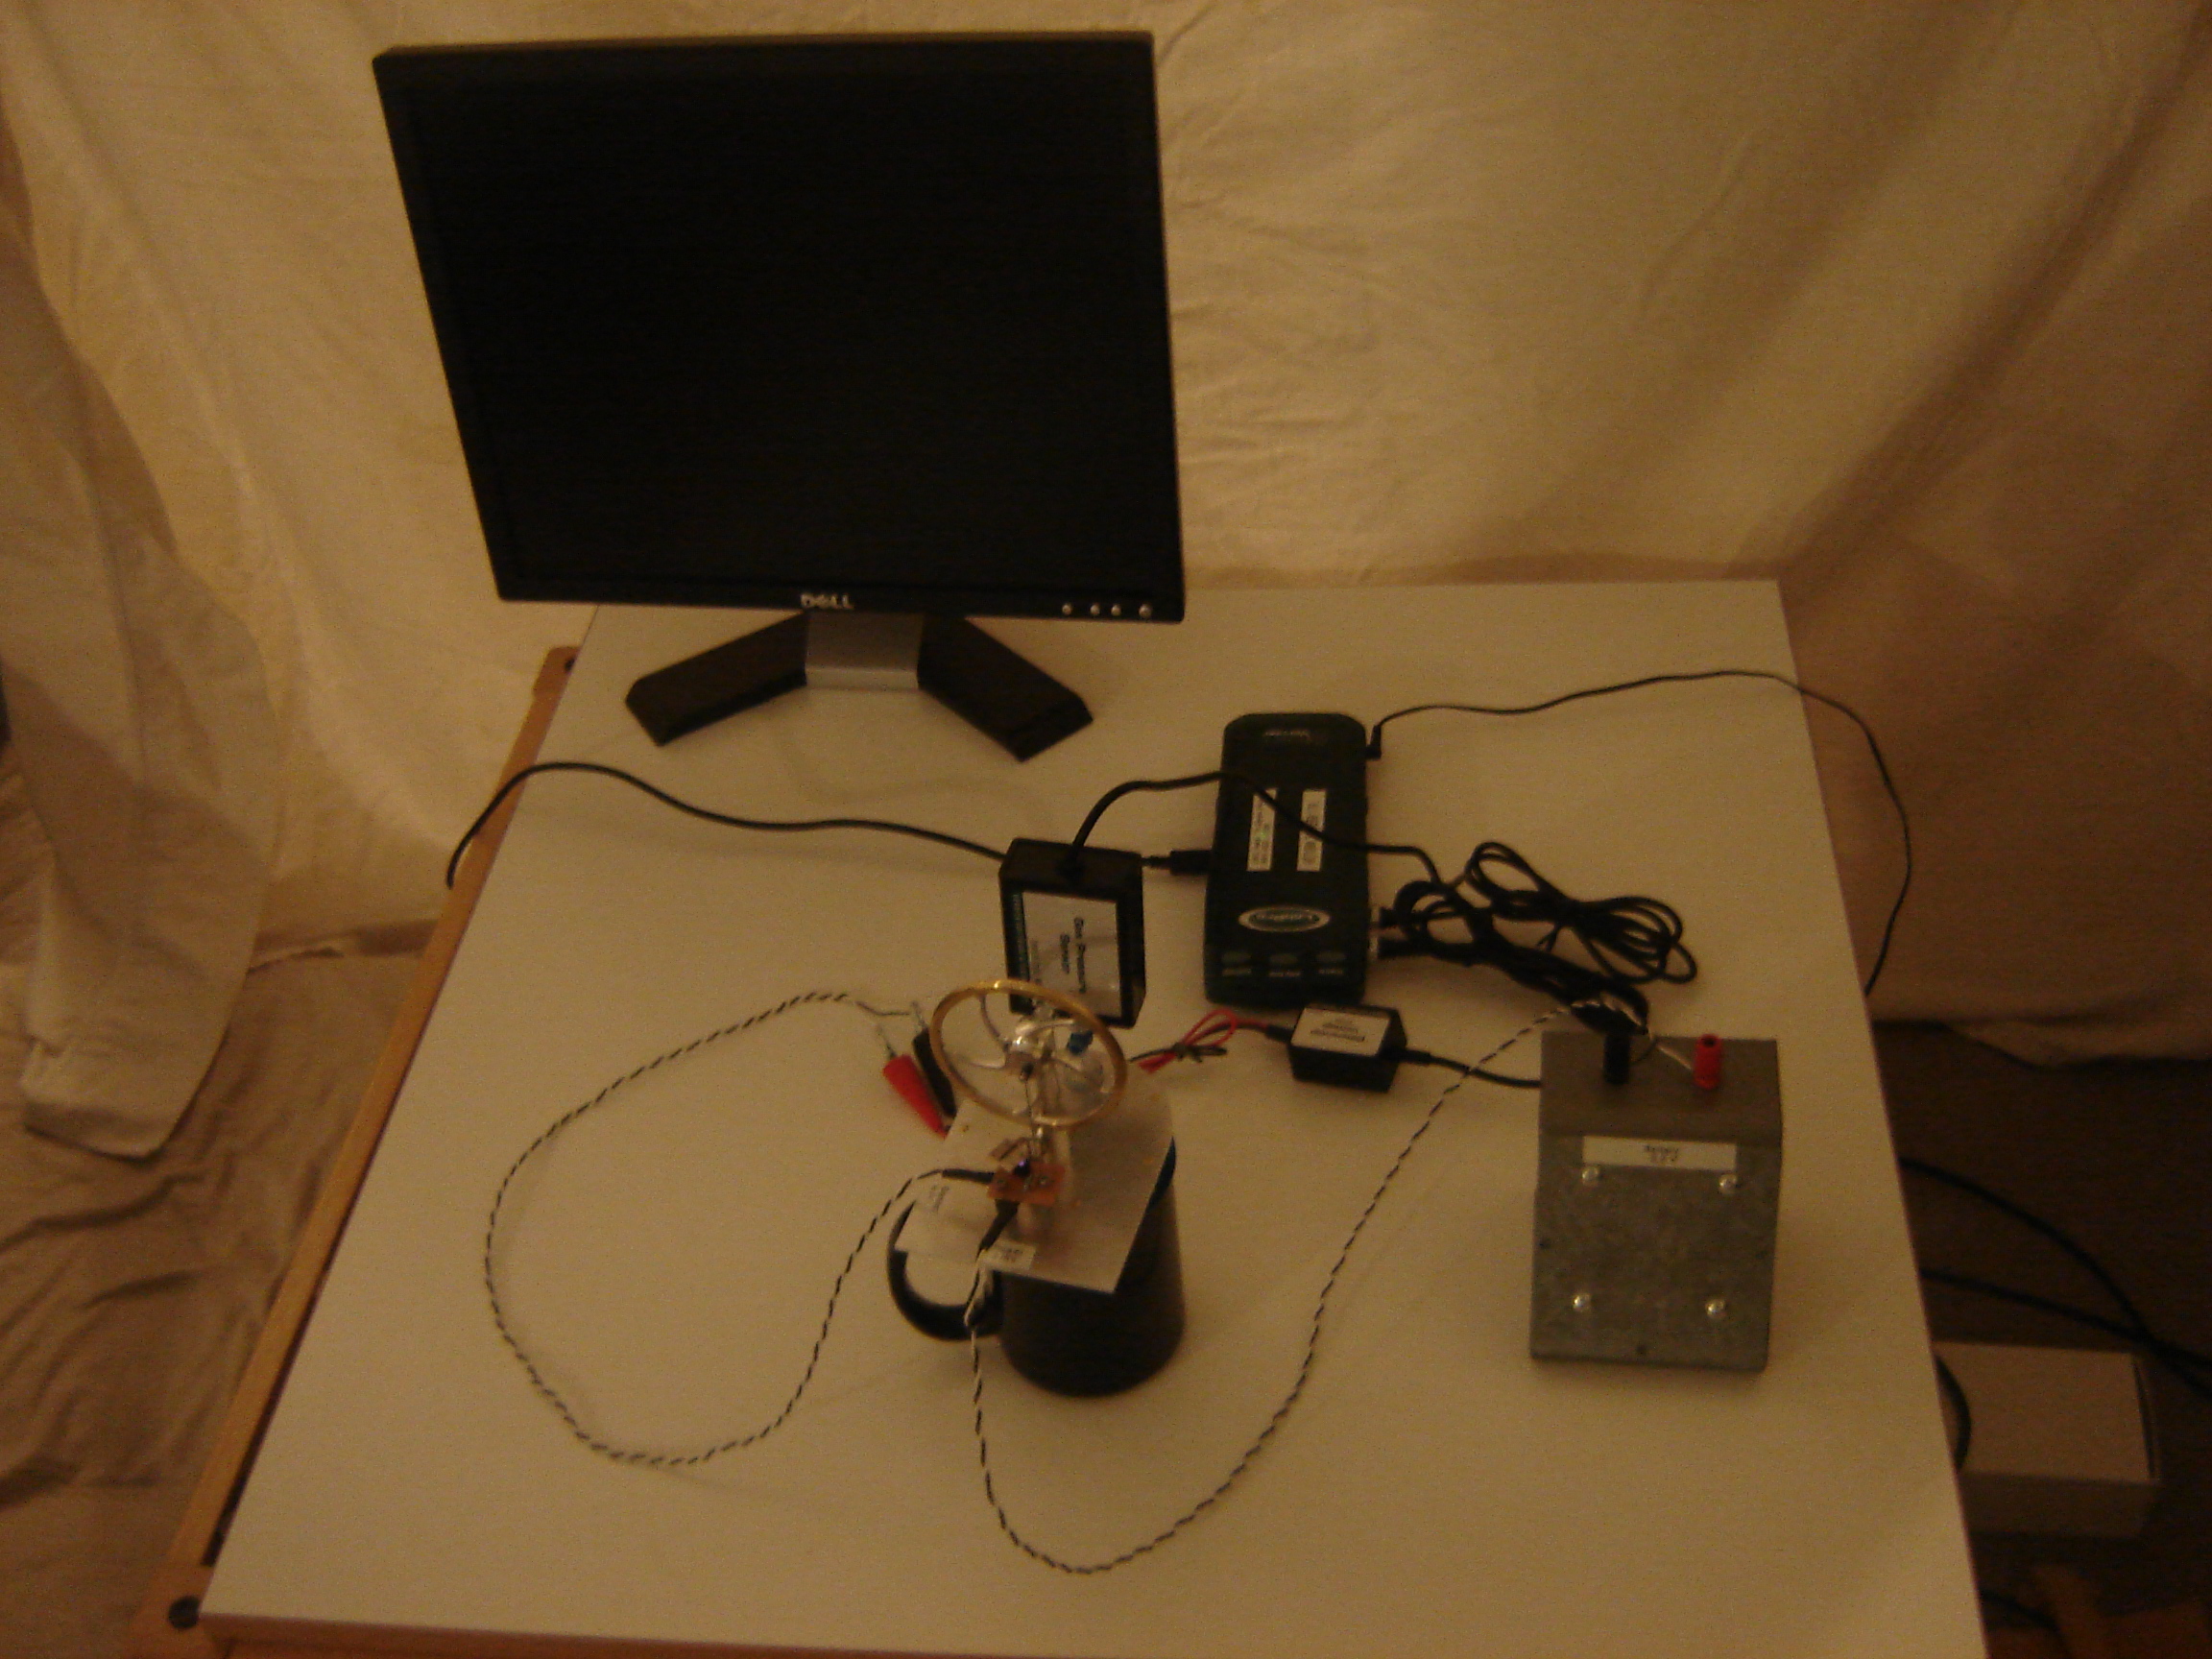
The volume change is measured by the infrared sensor as a voltage output. The sensor requires 5 volts DC to generate the
infrared light and to operate the photodetector, see Figure 3, left. This voltage was supplied by a battery box (Figure 3, bottom-right).
Data from both the pressure sensor and the differential voltage probe are acquired by the Vernier base station (Figure 3, top-right) and then
relayed to a PC running the LoggerPro data acquisition software.
Data was acquired at a rate of 10 samples per second and logged and displayed as a PV-diagram on a PC monitor in real time. The middle frame
of Figure 3 shows the complete setup.
The data was then analyzed to extract the frequency of the engine, the work done per cycle, and the power output of the engine.
|
|
|
Figure 3: Data Acquistion |
||
|
|
|