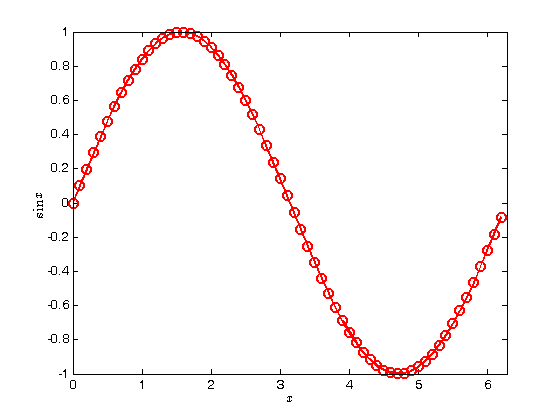
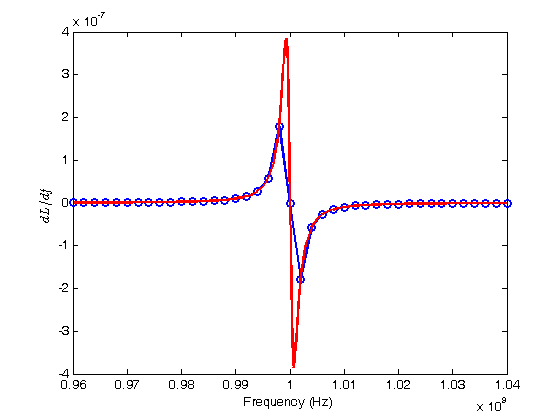
% Jake Bobowski
% August 18, 2017
% Created using MATLAB R2014a

% The tutorial basic_plots.m discussed how to plot data using 'plot' and
% 'errorbar' and then how to format those plots.  In this tutorial we plot
% functions.  Actually, there's no way in MATLAB to give the program a
% function and then tell it to plot the function from xi to xf.  You
% actually have to create a list of x data and then evaluate the function
% at all those values of x (thus creating a list of y data) and then plot y
% vs x as in basic_plots.m.  At first, this might seem odd, but it's
% actually not too bad.  In fact, it gives you full control of the density
% of points to be used in the plots, whereas other prorams will try to
% guess for you what might be a good number of points to use.

clearvars

% Here's a simple example of ploting sin x vs x.  First, create some x
% data.
xx = 0:0.1:2*pi;

% Next, create the y data
yy = sin(xx);

% Finally, create the plot.
plot(xx, yy, 'ro-', 'MarkerSize', 8, 'LineWidth', 2)
xlabel('$x$', 'Interpreter', 'LaTeX')
ylabel('$\sin x$', 'Interpreter', 'LaTeX')
axis([0 2*pi -1 1])

% Here's another example.  The function plotted below is the frequency
% derivative of a Lorentzian.  We first define a MATLAB function.
syms f f0 Q0;
dlorentz = @(f, f0, Q0) (Q0^2./f).*((f0./f).^2 - (f/f0).^2)./((1 + Q0^2*(f/f0 - f0./f).^2).^(3/2));

% The derivative of the Lorentzian has sharp features near the resonance
% frequency.  First, we show what the plot looks like if we use too few
% points.
f0 = 1e9;
Q0 = 500;
ff = [960e6:2e6:1040e6];
figure();
plot(ff, dlorentz(ff, f0, Q0), 'bo-', 'LineWidth', 2)
xlabel('Frequency (Hz)')
ylabel('$dL/df$', 'Interpreter', 'LaTeX')

% Now we use 'hold on' to add a second curve to the figure we just created.
% For this second curve we'll use a varying density of points (high density
% near the sharp resonant freatures).  This results in a much smoother
% curve that better represents the true features of the function.
hold on;
ff = [960e6:2e6:990e6, 990e6:1e6:997e6, 997e6:0.1e6:1003e6, 1003e6:1e6:1010e6, 1010e6:2e6:1040e6];
plot(ff, dlorentz(ff, f0, Q0), 'r-', 'LineWidth', 2)
hold off;