% Jake Bobowski
% July 27, 2017
% Created using MATLAB R2014a

% In this tutorial we will interpolate between points provided in a thermistor
% calibration file and then use the interpolated data to convert a set of
% resistance measurements in ohms to temperature in celsius.

clearvars

% The first step is to import the calibration data and the experimentally
% measured resistance readings.

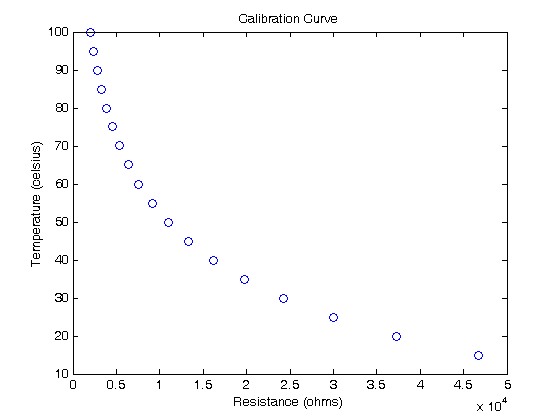
% Here's the calibration data
calData = dlmread('thermister calibration data.dat');
Rcal = calData(:,1)';
Tcal = calData(:,2)';
plot(Rcal, Tcal, 'bo')
xlabel('Resistance (ohms)')
ylabel('Temperature (celsius)')
title('Calibration Curve')

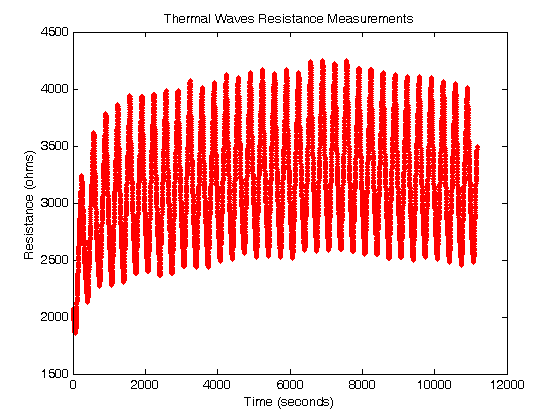
% Here's the measured resistances from a PHYS 232 thermal waves experiment.
% The first column of data in the file is time in seconds.
exptData = dlmread('thermalWaves-12092010-00-x05cm f003Hz V80V.dat');
time = exptData(:,1)';
Rexpt = exptData(:,2)';
figure();
plot(time, Rexpt, 'r.')
ylabel('Resistance (ohms)')
xlabel('Time (seconds)')
title('Thermal Waves Resistance Measurements')

% To do the interpolation, we will use the built-in MATLAB function
% interp1 (note that the last character is a 1, as in 1-D, and not ell).
% To use interp1, you must supply the x calibration data (Rcal), the y
% calibration data (Tcal), and the set of measurements that you want to
% convert from x-type to y-type (Rexpt).  You should ensure that the data
% that you want to convert from x to y all falls within the limits of the
% calibration data.  The output of interp1 is a 1-D vector of converted
% data (in our example a vector of temperatures at all of the times that
% were in the original experimental data).
Tinterp = interp1(Rcal, Tcal, Rexpt);

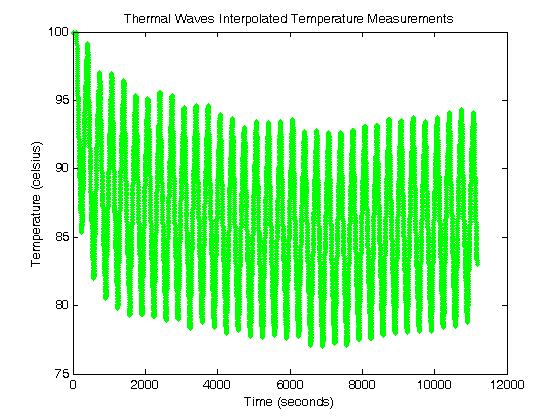
% Here's a plot of the data after using interp1 to convert the resistance
% measurements to temperatures.
figure();
plot(time, Tinterp, 'g.')
ylabel('Temperature (celsius)')
xlabel('Time (seconds)')
title('Thermal Waves Interpolated Temperature Measurements')


