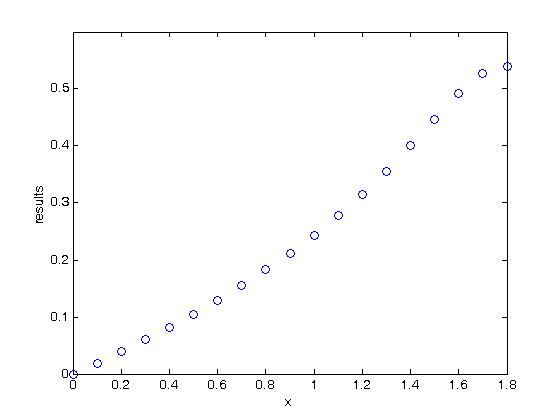
% Jake Bobowski
% July 27, 2017
% Created using MATLAB R2014a

% This tutorial will introduce simple implementations of for loops.

clearvars

% Here's the simplest for loop.
for i = 1:10
    i
end;

% The loop can be made to increment in steps of two as follows:
for i = 1:2:10
    i
end;


% Often, you may wish to perform calculations within a loop and then store
% the results of those calculations in a vector.

% The first step is to determine how many interations your loop with
% execture.  This tells you the length of the vector you need to construct.
% Let's imagine that our loop will interate from 0 to 1.8 in steps of 0.1.
% We can build a vector of these values, called x, as follows:
x = 0:.1:1.8;

% The length of x tells us how big our results vector needs to be.
n = length(x);

% We perpare a vector of right length that is filled with zeros.  If we
% enter zeros(n) we get an n x n square matrix of zeros.  Entering zeros(n,
% 1) results in a column vector of zeros of length n, while entering
% zeros(n, 1)' gives a row vector of n zeros.
results = zeros(n, 1)'

% We can now index our results vector within a for loop and assign values
% to each element of the vector and then display the results vector.
umax = 0.54;
M = -4.2703;
D = 1.8;
for i = 1:n;
  results(i) = (umax/M)*log(1 + (exp(M)-1)*(x(i)/D)*exp(1-x(i)/D));
end
results

% In fact, we can now easiy plot results vs x.
plot(x, results, 'bo')
xlabel('x');
ylabel('results');
axis([0 1.8 0 0.6])
i =

     1


i =

     2


i =

     3


i =

     4


i =

     5


i =

     6


i =

     7


i =

     8


i =

     9


i =

    10


i =

     1


i =

     3


i =

     5


i =

     7


i =

     9


results =

  Columns 1 through 13

     0     0     0     0     0     0     0     0     0     0     0     0     0

  Columns 14 through 19

     0     0     0     0     0     0


results =

  Columns 1 through 7

         0    0.0192    0.0392    0.0601    0.0819    0.1050    0.1293

  Columns 8 through 14

    0.1550    0.1825    0.2119    0.2436    0.2780    0.3154    0.3561

  Columns 15 through 19

    0.4001    0.4464    0.4914    0.5265    0.5400