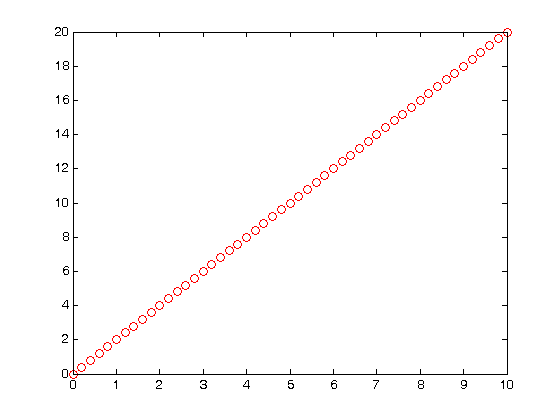
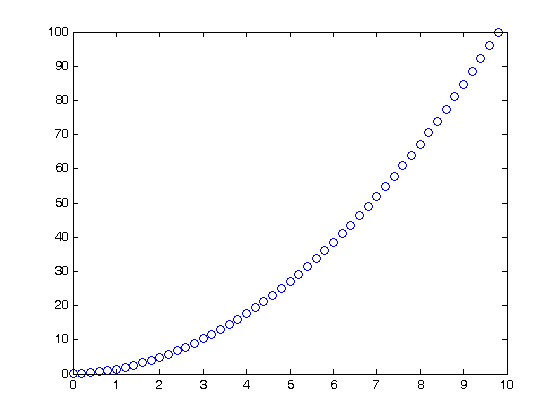
% Jake Bobowski
% June 11, 2016
% Created using MATLAB R2014a

% Clear all variable assignments.
clearvars

% In this MATLAB script we attempt to integrate a discrete dataset.  First,
% let's generate a trivial (and noiseless) set of linear data.
x = (0:0.2:10);
y = 2.*x;
plot(x,y, 'ro')

% One way to evaluate the integral is to use the MATLAB function 'trapz'
% (meaning use the trapezoid method).  Note that the integral finds the
% area under the function.  The area under our striaght line of slope 2 is
% (1/2)*10*20 = 100.
trapz(x,y)

% We can also use a for loop to implement our own approximate integration
% scheme.  Imagine approximating the area under the curve as a series of
% rectangles.  Each has a height of h = (y(i+1) + y(i))/2 and a width dx =
% x(i+1) - x(i).  We simply add up the areas of all the rectangles.
int = 0;
for k = 1:length(x)-1
    int = int + (y(k+1) + y(k))/2*(x(k+1) - x(k));
end
int

% The advantage of this second method is that, with a simple modification,
% we can plot the integral of the data.  We simply keep track of how the
% area changes as we increase x.  First make a list (intList) full of zeros uisng
% 'zeros', then replace the zeros in the list with the appropriate value of
% the area.  If there are N points in the list, then intList will have N-1
% points.  We expect the integral of a straight line to be a quadratic.
int = 0;
intList = zeros(1,length(x)-1);
for k = 1:length(x)-1
    int = int + (y(k+1) + y(k))/2*(x(k+1) - x(k));
    intList(k)=int;
end
int
x1 = x(1:length(x)-1);
figure()
plot(x1,intList, 'bo')
ans =

   100


int =

   100


int =

   100