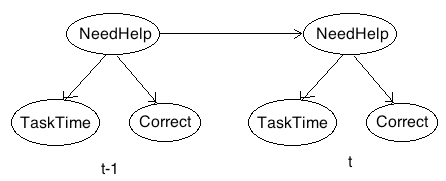
- mk_hints.m
(defines a simple DBN reviewed in class)
- Run mk_hints to get a DBN from it
- Follow steps on Slide 21
- Additional helper files needed: normalize.m
- sim_hints.m
(sets up a basic inference environment as reviewed in class)
- Run sim_hints with the DBN you get from mk_hints, try different settings, make sure you understand the inference graphs that are generated
- You should be able to replicate the graphs on Slides 46-49
- Additional helper files needed: sampleHint_seq.m, sampleRow.m
- sim_hints_decision.m
(sets up a decision making environment as reviewed in class)
- Run sim_hints_decision with the DBN you get from mk_hints, try different settings, make sure you understand the expected utility graphs and text otuput that are generated
- You should be able to replicate the graphs on Slides 62-64, and you can try other settings as well
- Additional helper files needed: util_hints.m, get_meu_hints.m

where NeedHelp is a binary variable (false, true), TaskTime is a tertiary variable (too short, on task, too long), and Correct is a binary variable (false, true). Define the necessary CPTs using meaningful numbers that reflect your model intuitions. Be sure to document your model intuitions above your CPT definitions. Note: For simplicity, assume the observation functions are the same across time, so you will only need to define 4 CPTs (2 observation functions, 1 transition function, 1 prior distribution) in total.
- Use T = 50 (so you can see the patterns over a longer time interval)
- For the part that generates a series of evidence in advance, mimic the code in sim_hints_decision.m so that you also have 3 different ways of generating evidence. You will need to try these out later.
- Print out the evidence that gets generated. (You don't have to pretty-print this; just type the variable name without the semicolon so the output is dumped onto the screen.)
- To complete the third setting for generating evidence: Write a helper function in a separate file called sample_help_seq.m that takes as input the DBN, a fixed parent value of neediness for help, and an interval range T. The code creates an empty evidence cell structure for T time steps, then incrementally samples a value for TaskTime and a value for Correct at each time step by calling stoch_obs (this is a helper function defined within the file that is not visible to any other file).
- To decide which action should be taken: Define a helper function in a separate file called get_meu_help.m that takes Pr(NeedHelp = true) as input. Only two actions will be considered: helping the user and doing nothing. This function returns two things: the first is the calculated best action to take (as a String), and the calculated expected utility of help at that point in time. Both of these can then be displayed. In this file, you will compute the expected utility of help and the expected utility of doing nothing.
- Create a helper function in a separate file called util_help.m that takes two inputs: an action (String) and a value of neediness (0 or 1). This function defines the utility of help and the utility of doing nothing in the cases when the user needs help and when the user doesn't need help. All the utilities are defined in the range [-5,+5]. Be sure to document your model intuitions in the code.
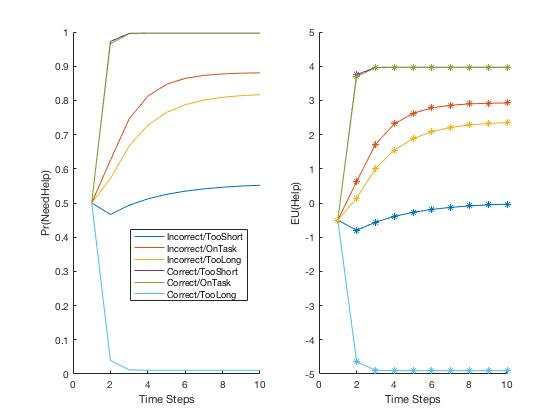
- Generate plots for the setting 2 ("fixed evidence") where you can
have combinations of the user always doing exercises incorrectly (or
correctly) and always taking too short amount of time (or on task, or too
long). Considering all combinations of these observation variable values,
you have a total of 6 graphs to generate. Your graphs should look
something like this (I've combined them all onto one graph for
convenience):

Note that the purple and green lines overlap a lot so it seems like there are only 5 cases when there really are 6. Interpret your graphs so that they make sense to you. The graphs should convince you that the CPTs in your model are defined in a sensible way. - Similarly, generate plots for the "random evidence" setting and the "controlled randomness" setting that uses your sampling code.